
Store Analytics
Get a comprehensive understanding of your store’s performance with 3 types of data insights:
- Performance Insights
- Top Product Insights
- Account Health
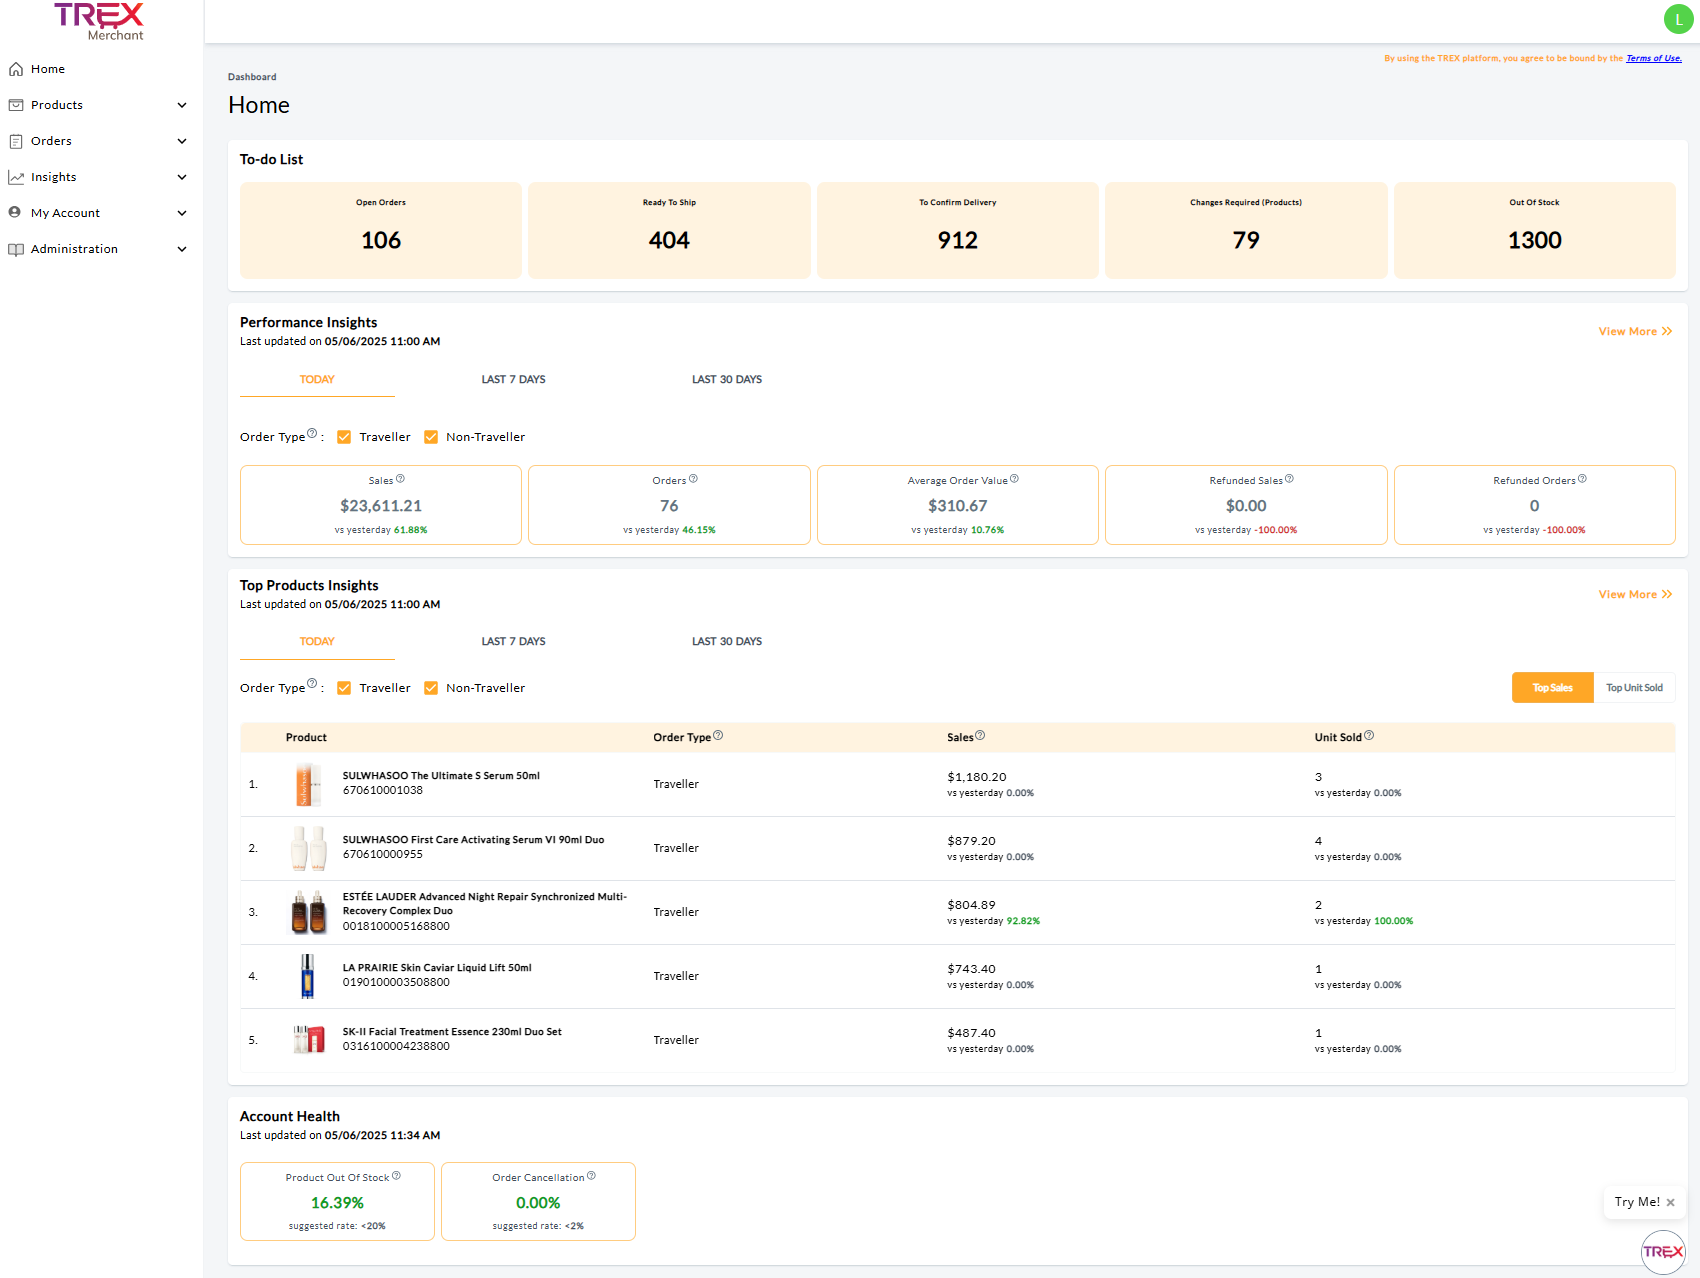
Performance Insights
This section provides a detailed view of your sales performance, including total sales, number of orders, average order value, refunded sales, and refunded orders. Get quick insights into business trends and identify opportunities or challenges across key metrics.
Last updated on
Data is refreshed in almost real-time, with hourly updates reflected in the “Last updated” timestamp e.g., DD/MM/YYYY XX:XX AM/PM.
Example: If the current time is 10:13 AM, the data reflects information as of 10:00 AM (the last completed hour). 
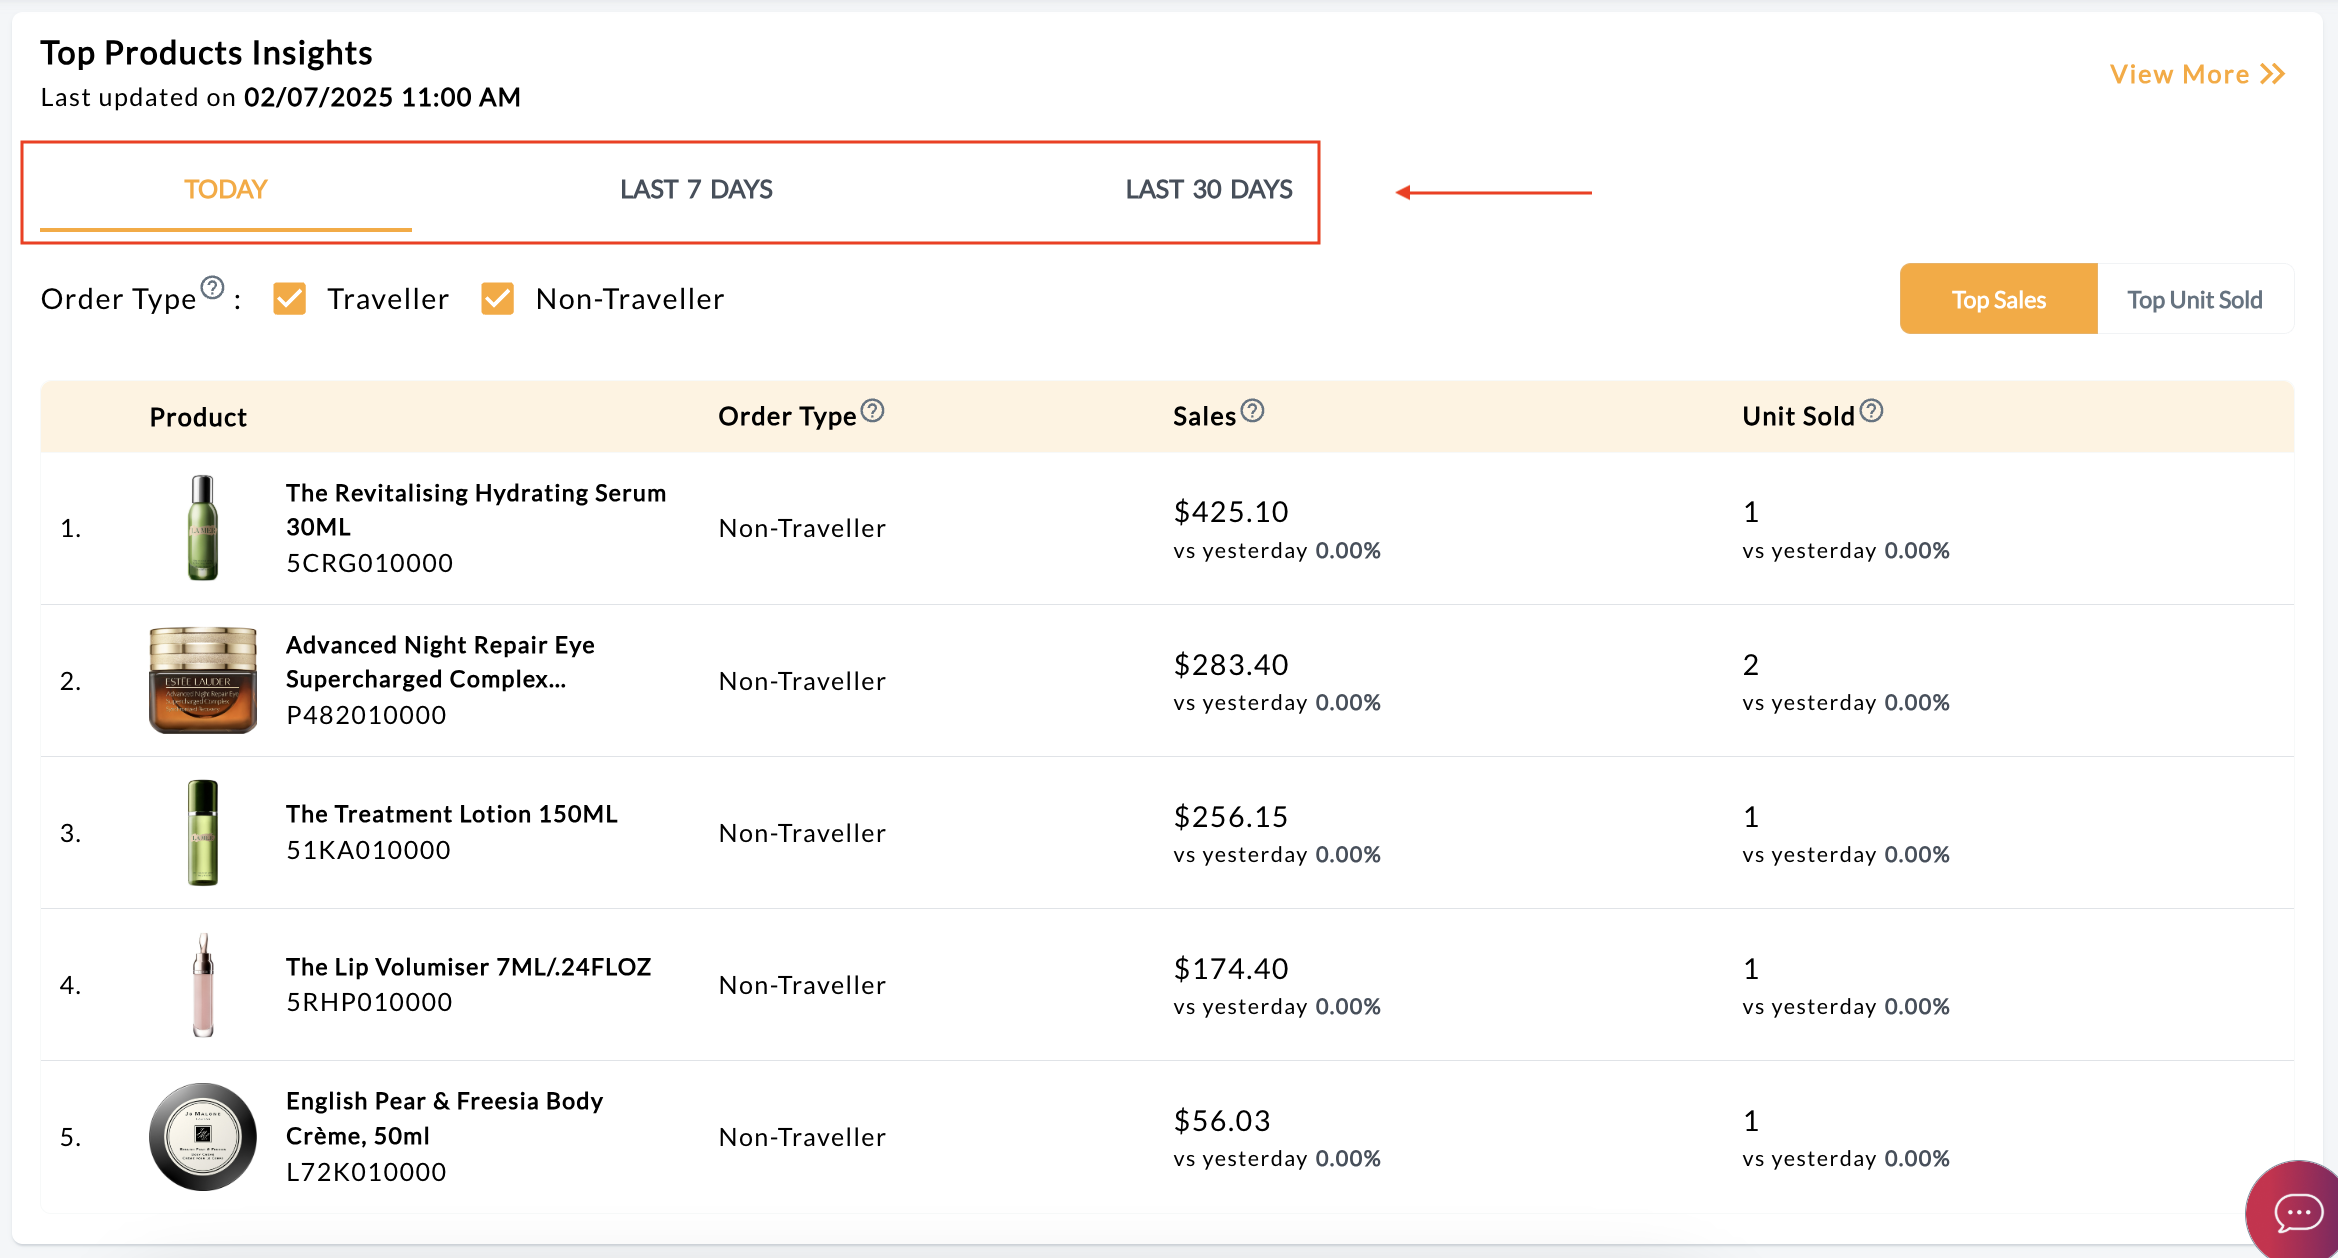
Time Periods
Users can compare performance across time periods by selecting tabs such as:
- Today (based on the last update) vs Yesterday
- Last 7 days vs Previous 7 days (excluding Today)
- Last 30 days vs Previous 30 days (excluding Today).

Customer Type Filter
The default view shows purchases made by both Traveller and Non-Traveller customers. Users can segment the data by selecting specific customer types using the available checkboxes.
Metrics
- Sales: Total sales based on the product’s final price after merchant-funded discounts, excluding platform-funded discounts. Includes all order statuses (Open, Ongoing, Cancelled, and Refunded).
- Orders: Total number of orders, including all statuses.
- Average Order Value: The average revenue per order.
- Refunded Sales: Total value of refunded sales due to cancellations or returns. Includes partial refunds, recorded by the cancellation/return date.
- Refunded Orders: Number of orders fully refunded due to cancellations or returns. An order is considered refunded only if all items in it were cancelled or returned.
Click the View More button to access additional information.
Access graphical representations of performance data. Choose metrics to display on the graph and refine your analysis by selecting time frames from the Date Period drop-down.
Options include: Real-Time, Yesterday, Last 7 Days, Last 30 Days, By Day, By Week, By Month, By Year.
How to Use This Data
- Select a Time Frame
Choose “By Year” to view data starting from the beginning of 2024.
Example: For 2025, data includes only completed months. If today is 2 Jul 2025, you’ll see data from 1 Jun to 30 Jun 2025.
- Compare Year-over-Year Trends
Use the comparison to analyze 1 Jan 2025 – 30 Jun 2025 against 1 Jan 2024 – 30 Jun 2024.
- Analyze Peaks and Dips
Example 1: Peak (Opportunity)
A spike in September 2024 may be linked to participating in the iSC Birthday campaign.
What You Can Do:
Cross-reference the Product Insights section to identify top-performing products during that time.
Consider repeating the same promotion or applying similar strategies for the current year.Example 2: Dip (Challenge)
A decline in August 2024 may indicate a lull period.
What You Can Do:
Plan ahead by participating in campaigns.
Run BAU promotions to maintain visibility during slow periods.
Top 100 Insights
Quickly understand your store’s performance by identifying top-performing products based on sales and units sold. The data is segmented by customer type across various time periods enabling you to identify the key factors driving their store’s success.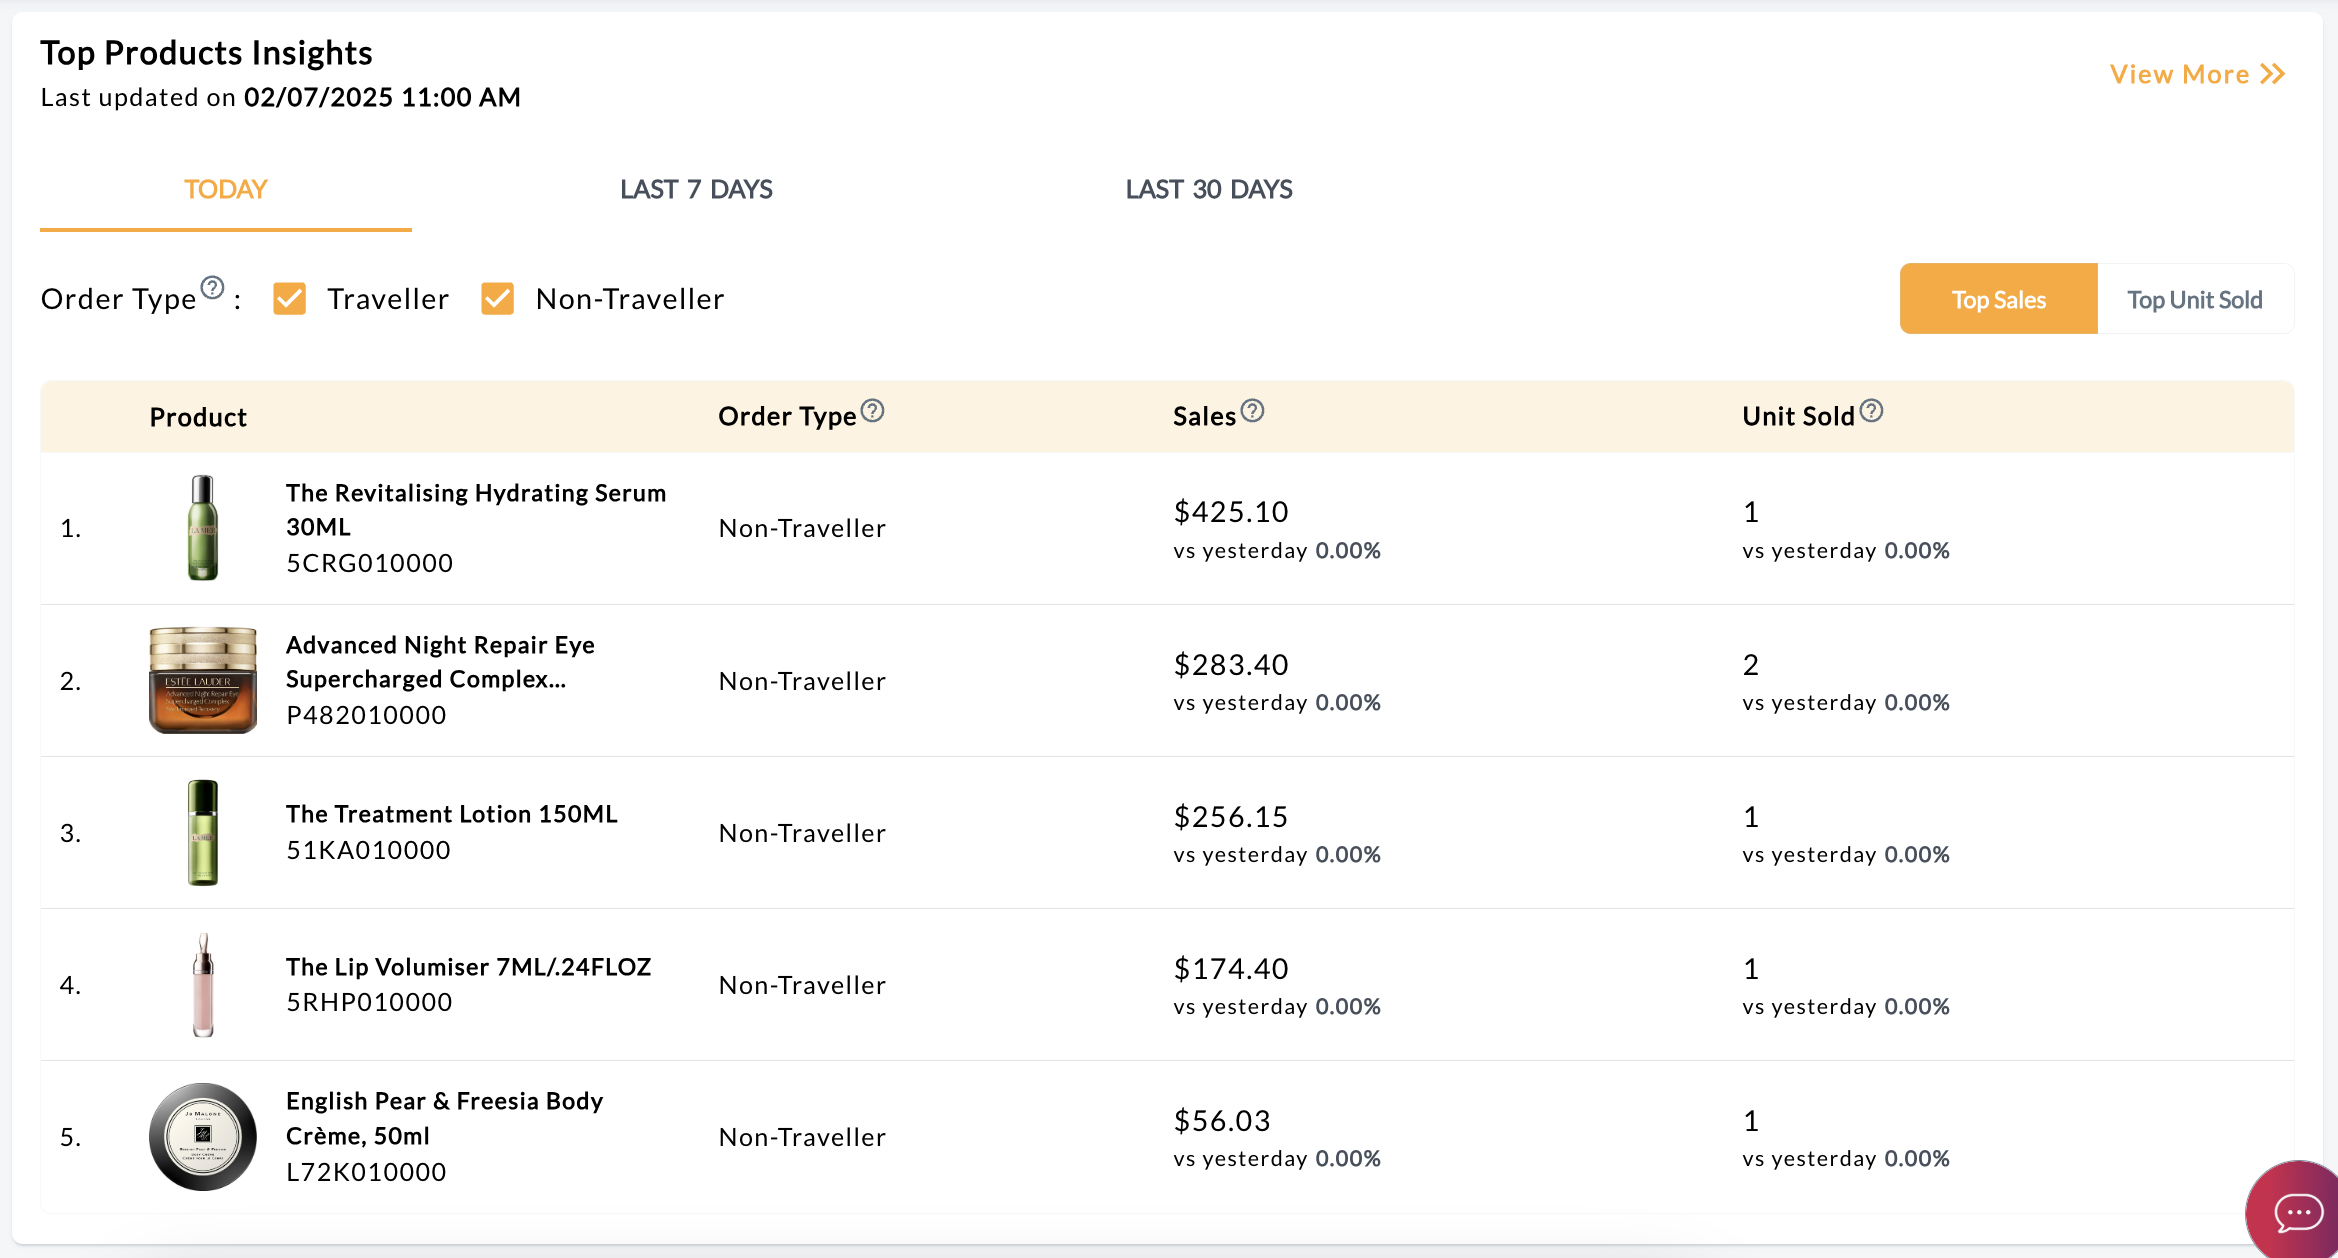
Last updated on
Data is refreshed in almost real-time, with hourly updates reflected in the “Last updated” timestamp e.g., DD/MM/YYYY XX:XX AM/PM.
Example: If the current time is 10:13 AM, the data reflects information as of 10:00 AM (the last completed hour). 
Time Periods
Users can compare performance across time periods by selecting tabs such as:
- Today (based on the last update) vs Yesterday
- Last 7 days vs Previous 7 days (excluding Today)
- Last 30 days vs Previous 30 days (excluding Today)
Customer Type Filter
The default view shows purchases made by both Traveller and Non-Traveller customers. Users can segment the data by selecting specific customer types using the available checkboxes.
Insights Table
Users can toggle between viewing Top Sales or Top Units Sold. By default, the table displays Top Sales.
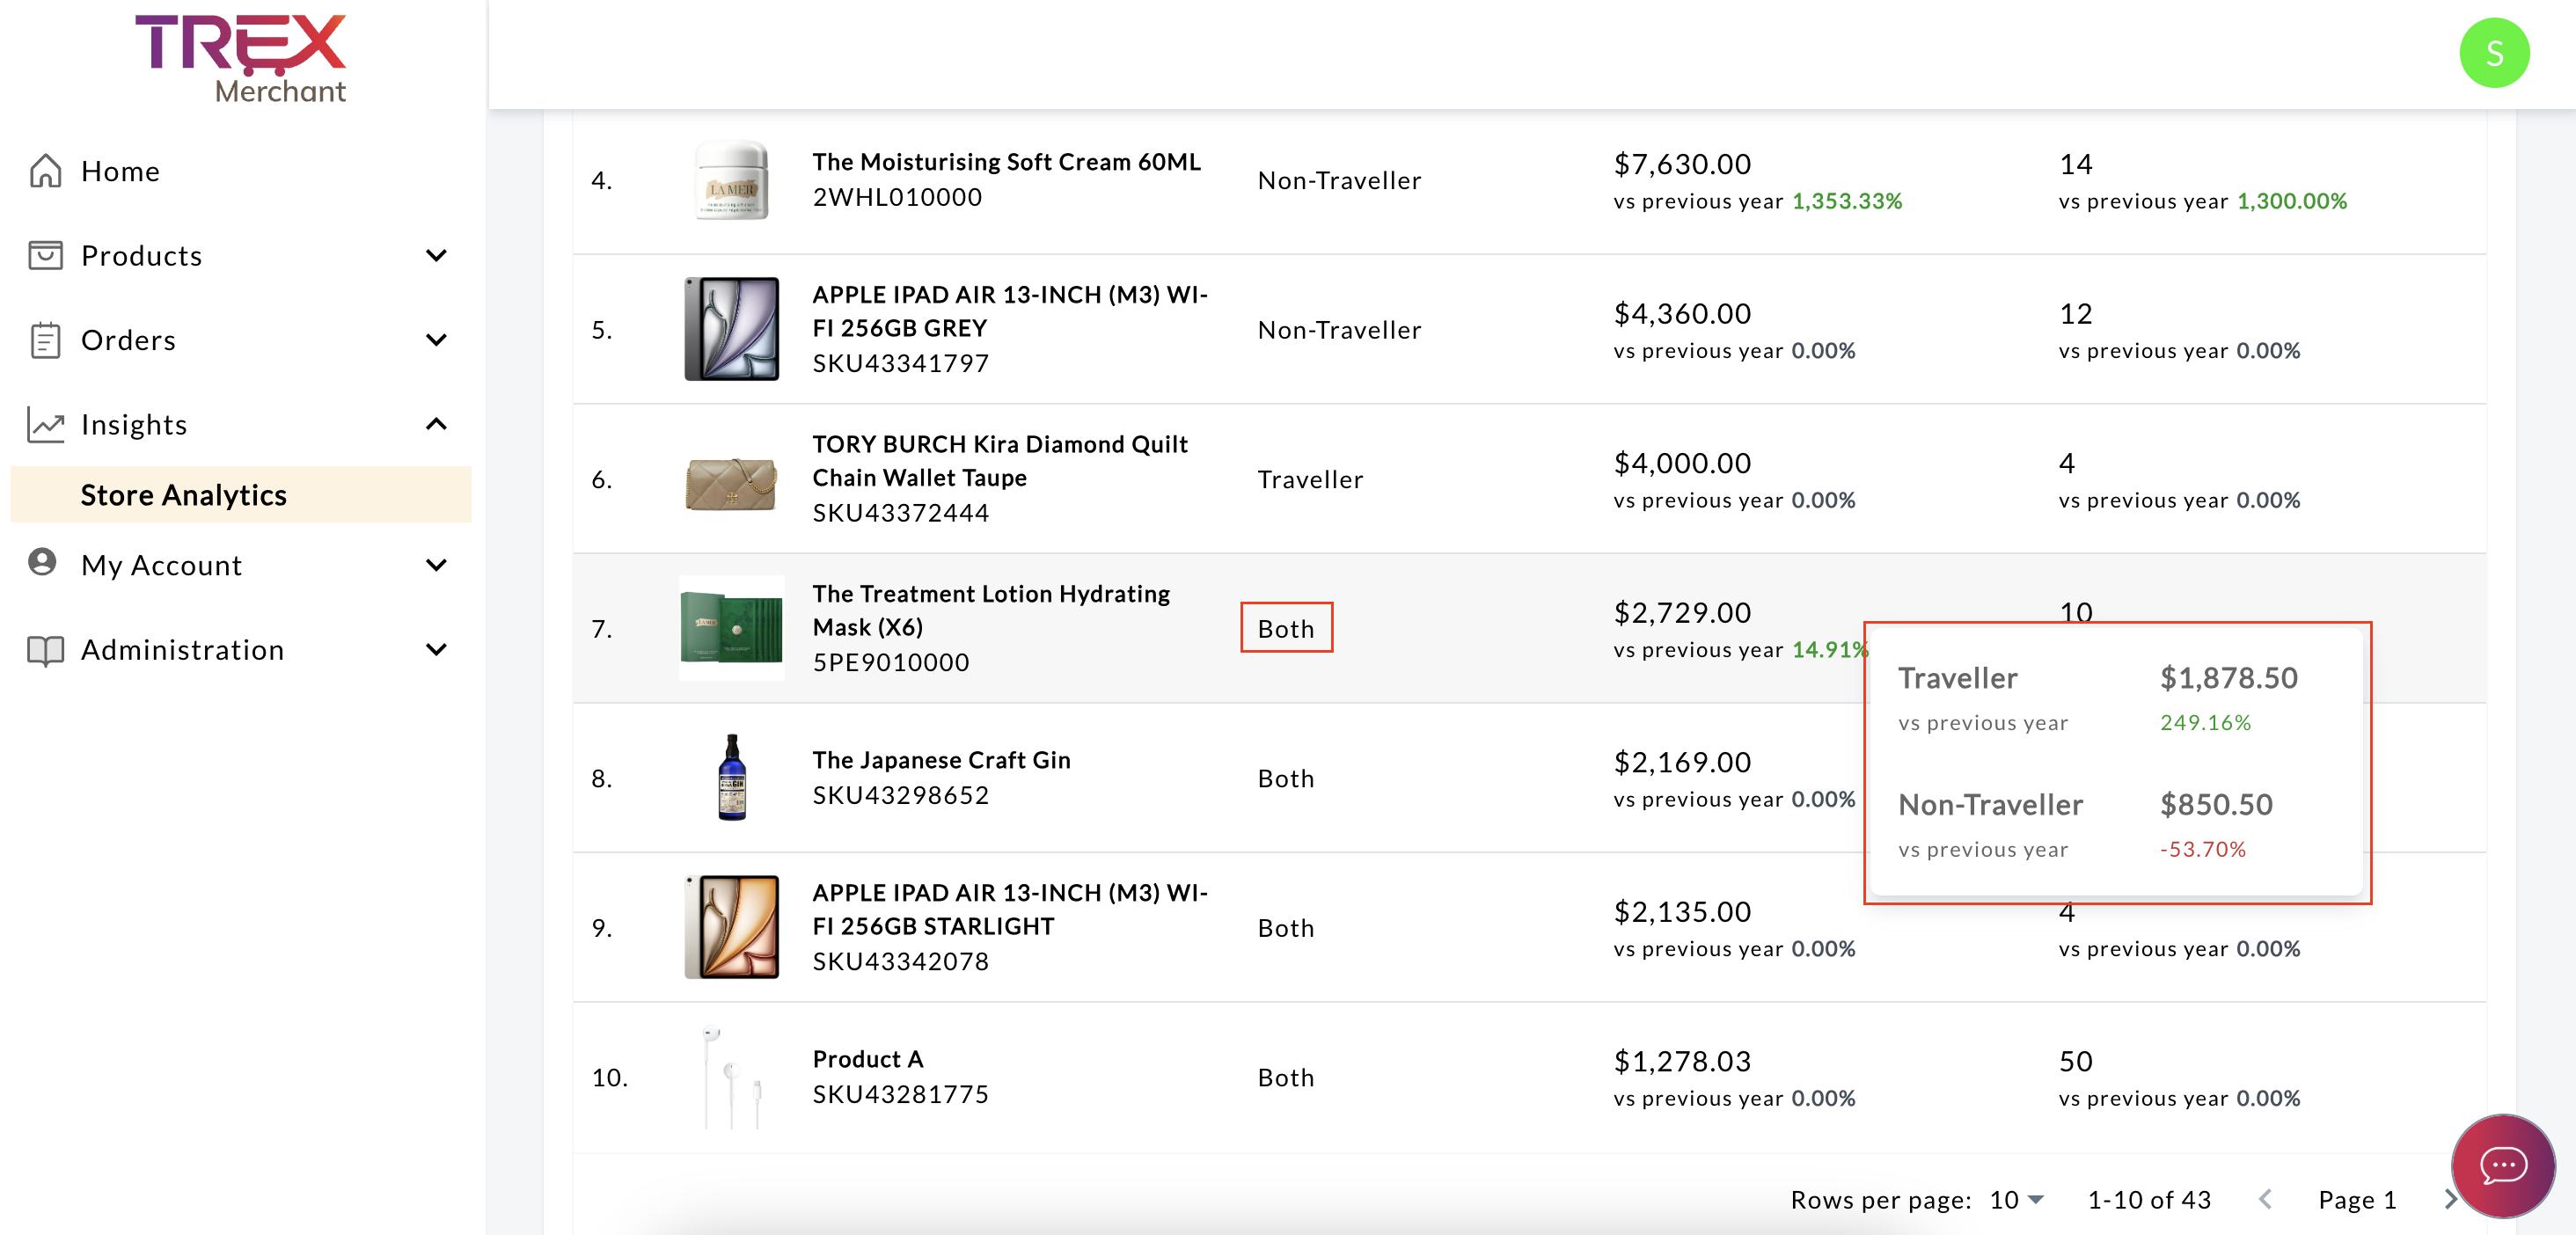
Click on View More on the top right to navigate to the Store Analytics page, where the Products tab provides up to the Top 100 Products insights and allows them to customise filters based on refunded sales and units as well.
Insights/Definitions
- Product: Displays the product image, name and SKU number.
- Order Type: Refers to purchases made by either Traveller or Non-Traveller customers. The default view includes both.
- Sales: Shows total sales based on the product’s final price after merchant-funded discounts, excluding platform-funded discounts. This includes all other order statuses: Open, Ongoing, Cancelled and Refunded.
- Unit Sold: Displays the total number of items sold, including all order statuses: Open, Ongoing, Cancelled and Refunded.
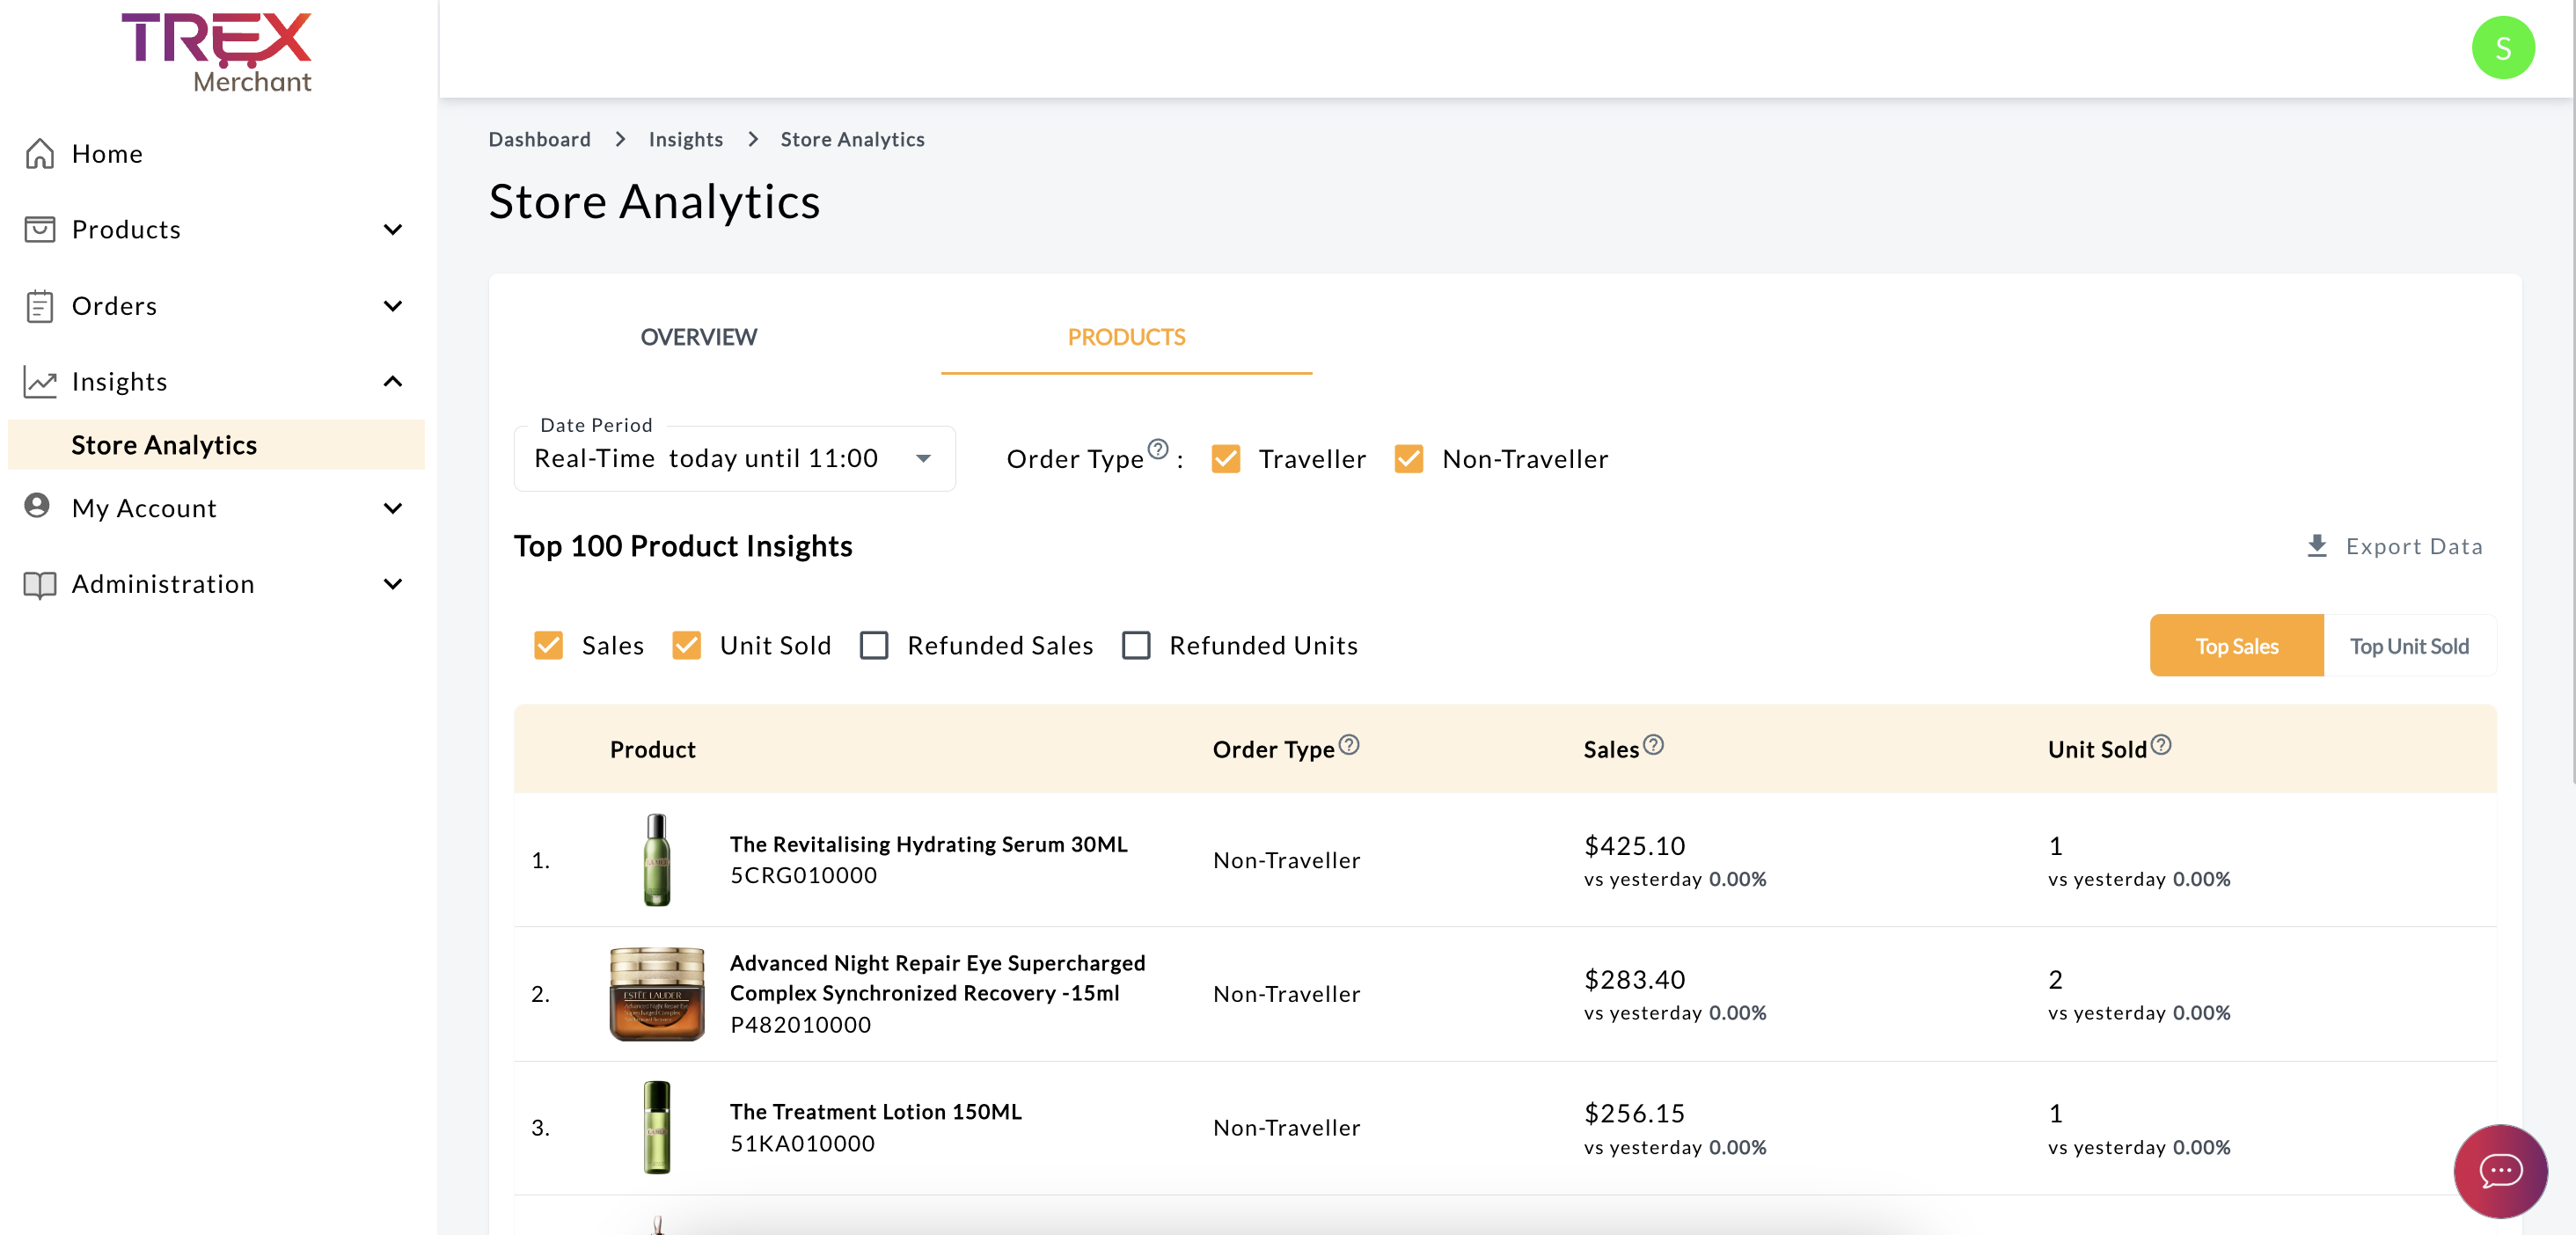
Export
Users can export data based on selected date range of filters for further analysis.
How to Use This Data
- Monitoring Key Product Launches: Check real-time sales performance to evaluate the success of new product launches. Identify top-performing products and plan for timely restocking if there is demand.
- Campaign Tracking: Compare data before, during, and after a campaign. Use insights to determine if targets were met and decide if additional stock or follow-up promotions are needed.
- MoM or YoY Trends: Identify products with positive growth (Green). Consider restocking trending products.
 Red highlights a decline, indicating a dip in performance. Investigate causes and explore solutions such as discounts or bundling promotions.
 - Identify Top Sellers and Address Slow Movers: Focus on top-selling products to maintain momentum. For slow-moving products, consider offering discounts, participating in BAU promotions, or running campaigns to improve sales.
- Review Refund Information: Use refunded orders to identify potential issues, such as delays in order fulfillment, mismatches in customer expectations, or insufficient product descriptions.
Account Health
Out of Stock (OOS) and Order Cancellation rates are critical metrics for monitoring and enhancing your store’s operational performance.
Last updated on
The data is updated in real-time with every refresh.
Metrics
- Product Out Of Stock: Represents the percentage of approved Out Of Stock (OOS) products as of the last update.
Suggested Rate: < 20%. - Order Cancellation: Percentage of cancelled orders by a merchant within the last 14 days. Note: Customer initiated cancellations are excluded.
Suggested Rate: < 2%.
How to Use This Data
- Replenish stocks timely.
- Process orders promptly to minimize cancellations.
- Ensure accurate product representation to meet customer expectations.